

On Monday night, I crashed Jonny Hall’s (@StudyMaths) session at MathsConfOnline where he talked about “How completion tables have changed [his] life”. Though he admits it is a slight exaggeration, it really isn’t an exaggeration to say that working with Jonny this past few months, particularly while he’s been obsessed with these tables has revolutionised my task-making and task-using abilities.
I have always considered myself to be more of a ‘thief’ of other people’s ideas and resources. I think my strength as a classroom teacher comes from my ability to plan a coherent route through a part of mathematics and explain it well. I pride myself on selecting examples and questions to help my students to grasp a concept and interrogate it further. I sometimes pick these up from someone else if I think it does the job really well, or in a way I might not have thought of yet. I’m constantly in awe of the things others produce as tasks for their classes. I won’t start a “list”, but there are some penomenal task makers in the maths teaching community, and my lessons are littered with their brilliance… I think this is the perk of being a maths teacher, we have a lot of people and places to consult for ideas for our lessons.
However, having seen some of the completion tables Jonny created, I started playing with them a little.
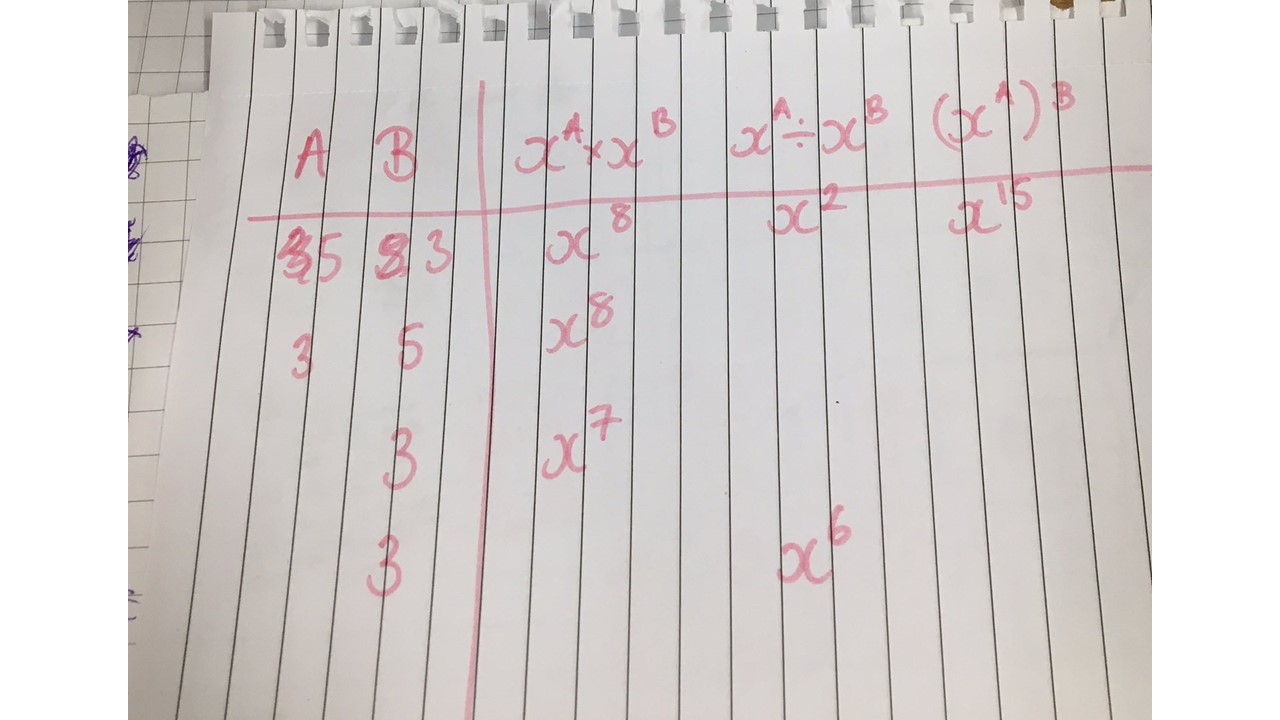
Index Laws
My first foray was looking at index laws with Year 11. I wanted something different to the usual list of questions, as it was revision. I started with the scribble below, and eventually typed it up into the “Red Zone Task”. I got quite invested in the incredible amount of maths that can be done by just choosing which cells to reveal and which to leave blank. I also started to incorporate some variation theory by keeping some cells the same, and forcing students to consider the impact on the others.
In this task alone, there was the basic skill being practiced, use of inverses, and then at the extreme levels there is simultaneous equations and some generalisation. There was an appropriate level of challenge for all students, a lot of discussion of answers, and I was satisfied that my students had really understood the concept of these laws after this task. It added even more coherence to my lessons.
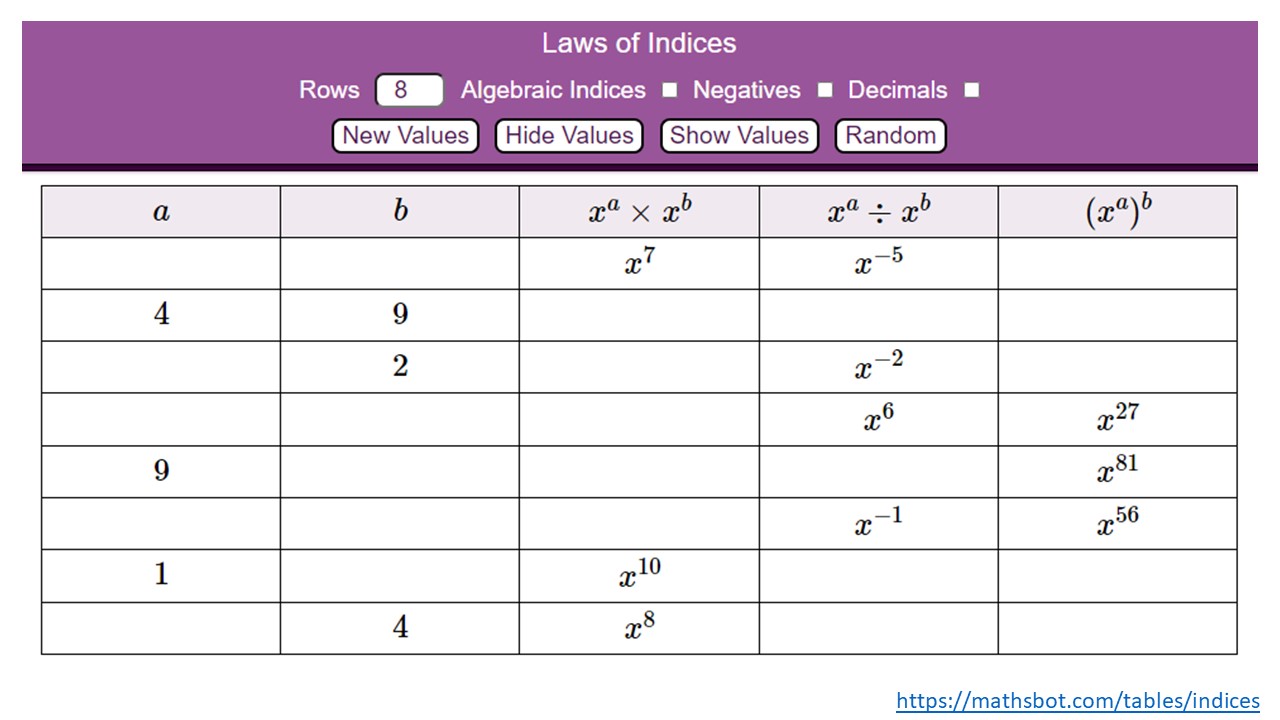
I obviously then showed Jonny, and he made it into this lovely automated version, which you can set up with interweaving algebraic indices for collecting like terms, expanding binomials and factorisation. It is a beaut.
I think both my ‘hand-made’ and the automated versions have their value… but I really enjoyed making the task to focus students attention on the structure of the maths, and found making it gave me an insight into the connections we could make across the topic too. The automated version obviously saves you a great deal of time, but with lesson control over the progression.


Median and Range
My next obsession was inspired by Jonny’s tables “Averages and Range”. As we follow the White Rose curriculum, I specifically wanted something to connect range and median for our shared Year 7 class, and as I had enjoyed making my own so much last time, I decided to have a go for myself again.

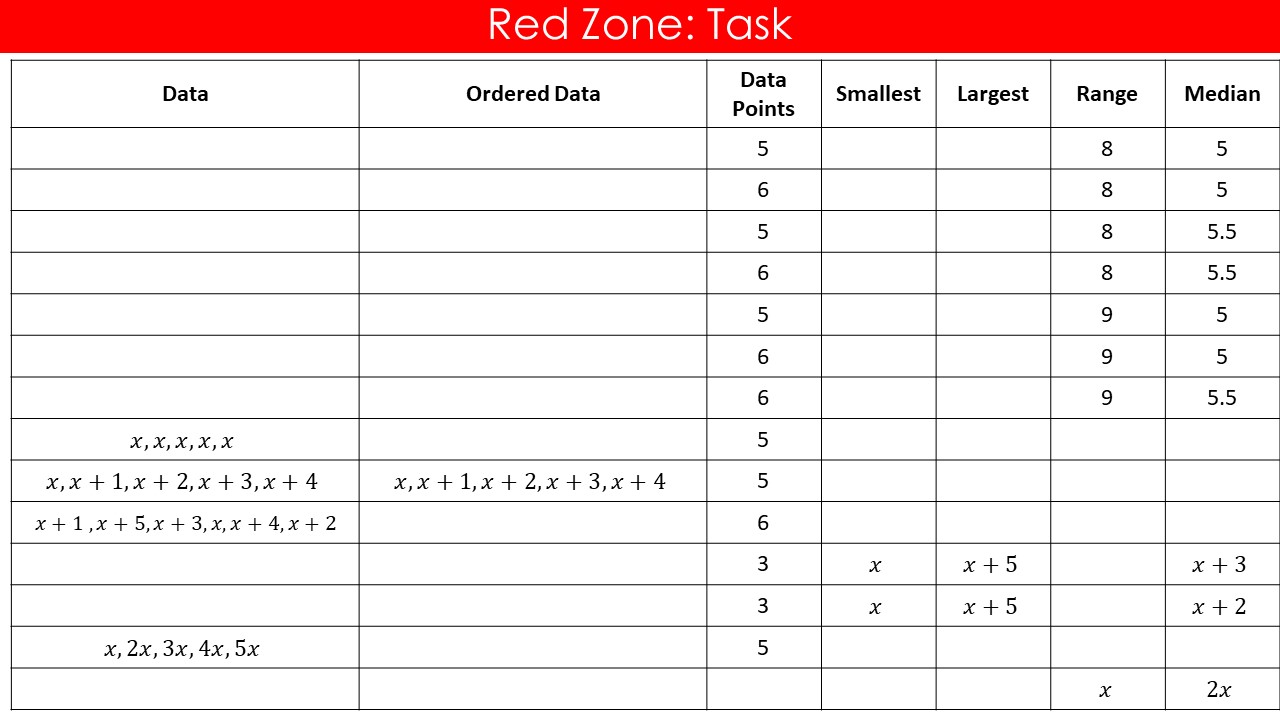
I got quite carried away with this one… it ended up being a two slide epic. I wanted there to be a lot of practice of the basic skill but also to extend our mixed ability group where we had some incredibly strong mathematicans. I began giving lots of information and missing numbers in the list, and then specifying the fatures the lists must have.
Again, I got really into the variation of this one. I kept some features static, row to row, varying the number of data points – really digging into the ‘odd and even’ cases for median – and a lot of opportunities for generalisation. Again the concept of median and range was important to me here – what features of your data set made it work? Was it the largest and the smallest number? Is there only one possible set of data points? If not, what part of them was important to fit the criteria? How did the odd and even number of data points affect things? Were there any impossible ones?
After considering these questions, I amped the generalisation up further to interleave the algebra unit we completed earlier in the year. I particularly loved these; we had lots of intresting discussions about how we knew which was largest as we had no idea if x was positive or negative in some of the rows.
Again, the students spent a huge amount of time talking to eachother about the maths here. Spotting if they had the same answers, and if not, why not? The structure of the maths was at the forefront again. I’m sure we’d all also agree that sometimes, Year 7 can be a year group that needs more guidance and structure, and so I was used to doing a lot of the talking in these lessons… and for once I had done a lot less talking than they had. (Maybe not less WORK, I took a long time to make this task but I really enjoyed interrogating the topic myself too!) It promoted a huge amount of mathematical thinking and independence, and I think this was an important thing for them too.
Co-ordinates
Jonny came into my room a few weeks ago, straight from detention duty, with a scrap of paper with two co-ordinates on it, followed by some topics you could use them with… “How can I make this better?” was the question. You can see the evolution of this one here. Along with how obsessed I got with the ‘unique solutions’ idea here.
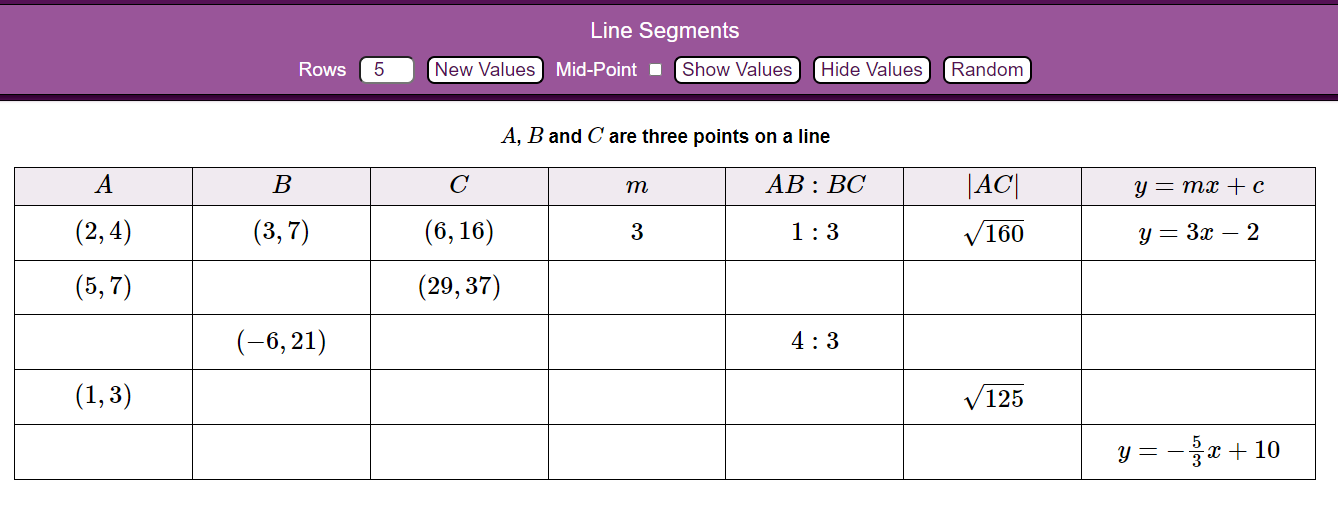
I think the discussion and thoughts I get while making or ‘playing’ with these myself are a testament to the versatility and utility of these tables. Even as a Mathematician with a First Class BSc in maths, and someone that has been teaching for 7 years, I am stil blown away by the level of mathematics in this one. There is so much thought that goes into even selecting which cells you want to reveal, and in which order, and then which of them have a unique solution, and why those may not be possible… Plus the scaffold is in-built – if you have worked in ‘one direction’, you can often use that to help you to work through another, or to work backwards.
Plans and Evlevations
I will preface this with the fact that I hate teaching this topic. I always have. I hated it when I was at school too. I now know that this is because I am aphantasic, a trait I share with many maths educators if my twitter circle is to be believed… and they all despise topics involving spatial awareness too.
My Year 9 class were really struggling with the idea of moving between 2D and 3D representations when learning plans and elevations. They had used many of King Don’s lovely resources (which took me HOURS to make sure I had answers to!) and some were still unsure… When I was at school, I taught myself how to cope with topics like this through repeatedly completing the questions I had access to and generalising the solutions…and I was getting to a point where I considered just giving them shape after shape, and exam question after exam question… but it just didn’t sit right with me to make all the students do that, particularly as some could just “see” it.
I ended up making this completion table. I think this was the right mix of ‘forward’ and ‘backward’, and generalisation. It almost scaffolded how I had taught myself the topic, with much fewer pages of exam questions!
Again the discussions it prompted were the best part of it, particularly the third row as lots of students knew it was supposed to be a cylinder but weren’t drawing it in the correct orientation. As usual, generalisation was the name of the game for the last row, and the conversations that happened around that were also brilliant.

In Summary…
I love these tables…
- They present a LOT of maths in a small space
- There are opportunities for fluency, problem solving and generalisation
- This in turn gets students to consider the structure of the maths and begin to generalise
- They promote mathematical discussion in the classroom – between you and students, but also between the students themselves
- There are many opportunities to consider variation and boundary cases
- There is a huge chance to promote links between or interleave topics that would normally be less obvious
- There is huge scope for interweaving topics, particularly algebra
- They help you to interrogate the topic more deeply yourself!
I am inredibly grateful for Jonny’s obsession with this as a template for task making at the moment, as it has made me consider myself as more of a ‘task-maker’ than I ever have before.
I would 100% recommend using the tables I have shared or the multitudes on Mathsbot… but also try to come up with some ideas for these tables yourself, as I think this is where the magic really happens.
Since the session on Monday, Jonny has had so many tweets and messages; it has been amaing to see what we have come up with as a comunity. Please do tag us in any ideas you have (@StudyMaths & @Arithmaticks) – often he sends me drafts of tables so I get to do some really cool maths with you! (Like I did with @NathanDay314 on Friday night!)
Editable versions of my slides are here:
