
So it turns out that its quite hard to find time or thinking space to write a blog when you return to the classroom with a new job on 16th June, then present at MathsConf38 on 21st June, then hit mock season, then travel to your brother’s wedding in Poland as term ends… With all that in the space of a month, writing a blog about my MathsConf session has had to wait until today – the Sunday before returning to school!
This session was a bit of a deep dive into the use of Ratio Tables to solve algebraic proportionality problems, including for inverse proportion. It was a follow on from my sessions at earlier MathsConfs, summaries of which you can find here:
- MathsConf24 – Teaching Compound Measures with Ratio and Proportion
- Ratio Tables Across the Curriculum
- Ratio Tables: Moving to Generalisation
In that last blog/session, I began to share my methods for using ratio tables for algebraic problems, but I didn’t feel I did it as much justice as I wanted to. As you can see in that blog post, that I had a bit of post-COVID brain fog, and I also just tried to cram way too much into one session… so after being asked about it more since MathsConf33, I thought that I would try it again, with the benefit of hindsight and some more time to let the ideas mature. In this session, I talked a lot less, live modelled a large number of questions and then let the delegates have a go themselves to see the power of the representation.
I think the last post explains a lot of the specifics and thoughts about why I think this is powerful. But I would like to reiterate that the best thing I think we can do for our students is help them to build strong conceptual knowledge of maths. A huge part of this can be done through using consistent representations across the curriculum, allowing students to more easily make links between related concepts and understand the real structure of the mathematics they are studying. My aim here is to help them to see different areas of maths as interconnected and to stop them seeing our beautiful subject as a bunch of disconnected facts and procedures to sift through.
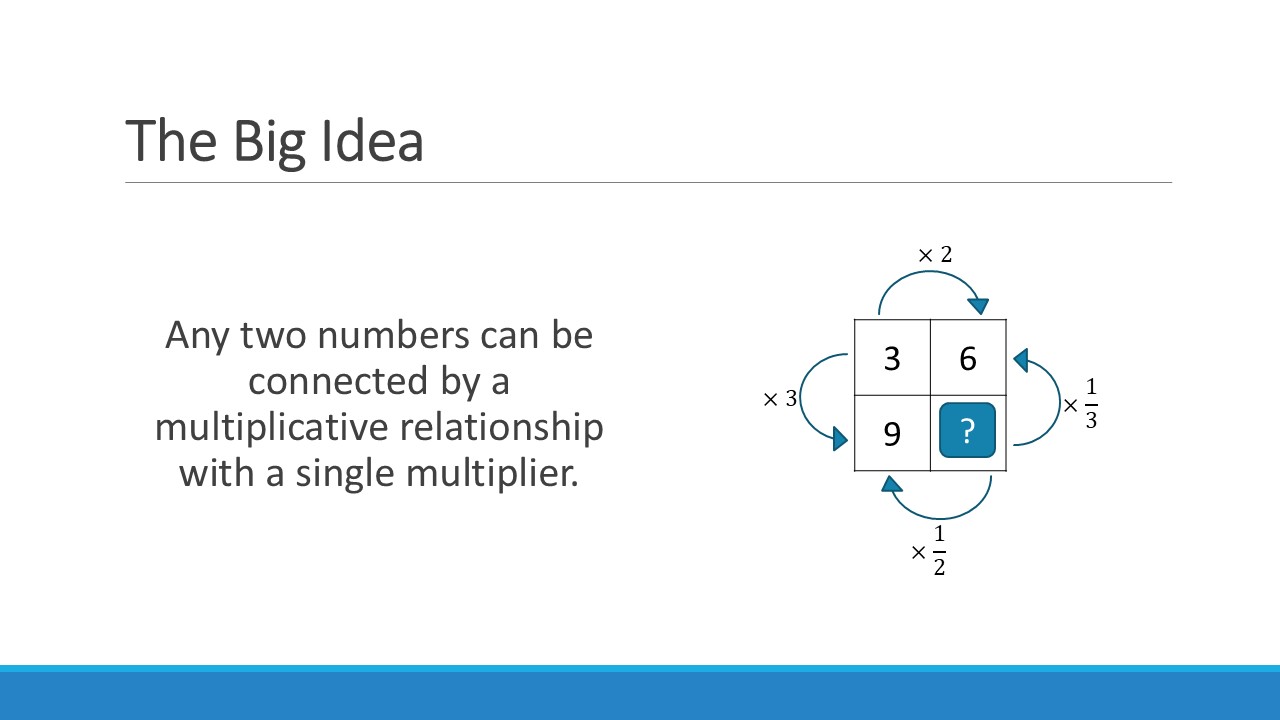
When I became a teacher, I started seeing these links so much more clearly, and I started wanting to tackle them head on. My biggest bug-bear was that I was taught to solve proportional reasoning problems, such as recipe problems and best buys, in a fundamentally different way to how I was taught to calculate unit conversions or compound measures, which again was different to how I worked with fractions, trigonometry, pie charts, and algebraic proportionality… Because they are all fundamentally all multiplicative reasoning problems, and they should not be treated as isolated ideas. And I will quote myself here, without feeling too narcissistic, because I think it’s an important point:
What I am arguing is that using the same representation consistently is key to building the conceptual understanding that multiplicative relationships are structurally no different in a generalised algebraic form.
Ratio Tables: Moving to Generalisation
When I worked at Outwood Grange, their shared resources used a table structure for speed and I was hooked for compound measures, revolutionising my students’ understanding of speed/density/pressure as a unit ratio – so much so that it was the topic of my first ever ‘mathsy’ conference session. Then I saw how the brilliant Don Steward used ‘Boxes’ (Resources, Teacher Notes) to use this representation overtly for geometry and statistics topics. But I still felt there was a gap for algebraic problems… and I knew that I could bridge the gap from memorising formulae, because that is exactly what I had been doing for speed calculations for a few years. It took some time to work out how I wanted to present it, and a number of years of trying it with different classes. But I think I am settled on the approach I showed at MathsConf 38 now.
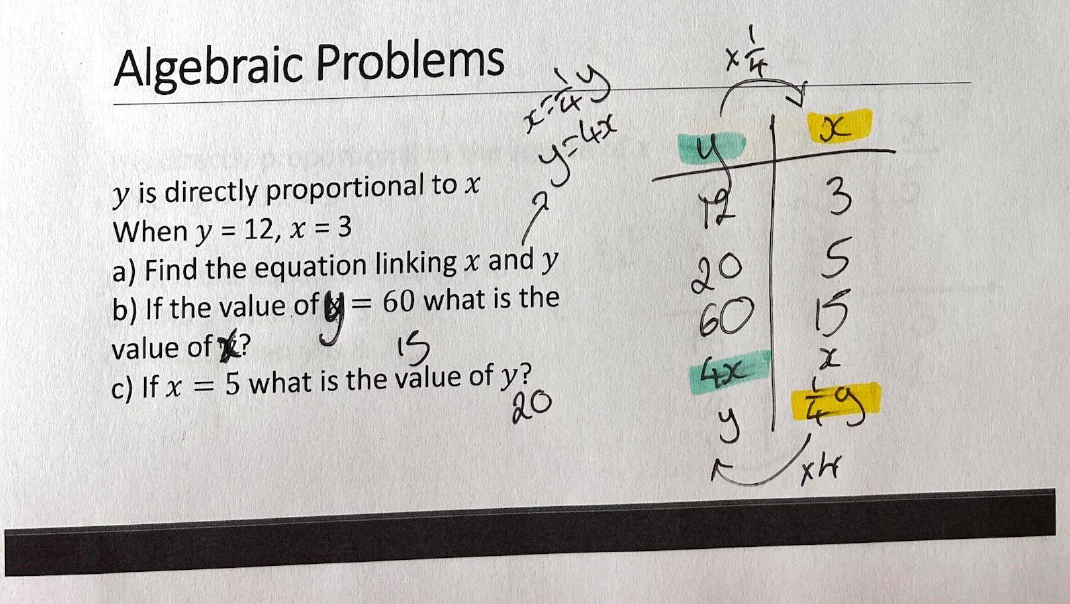
Direct Proportion
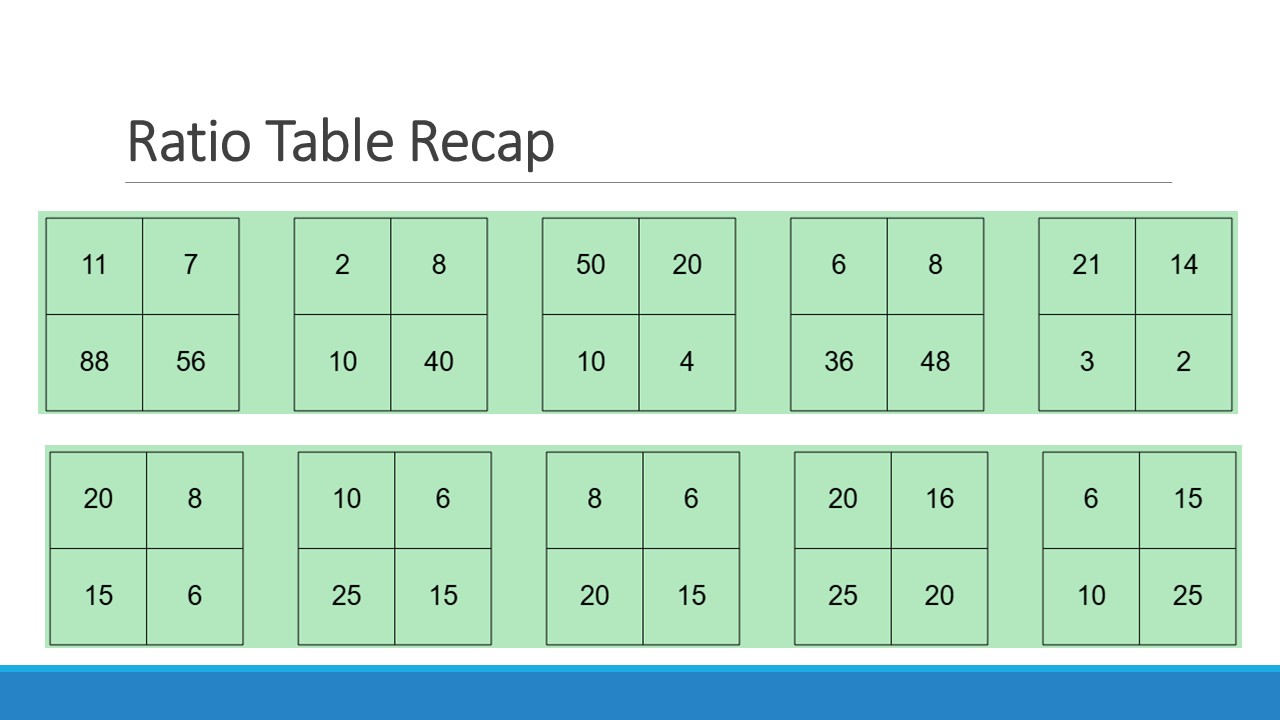
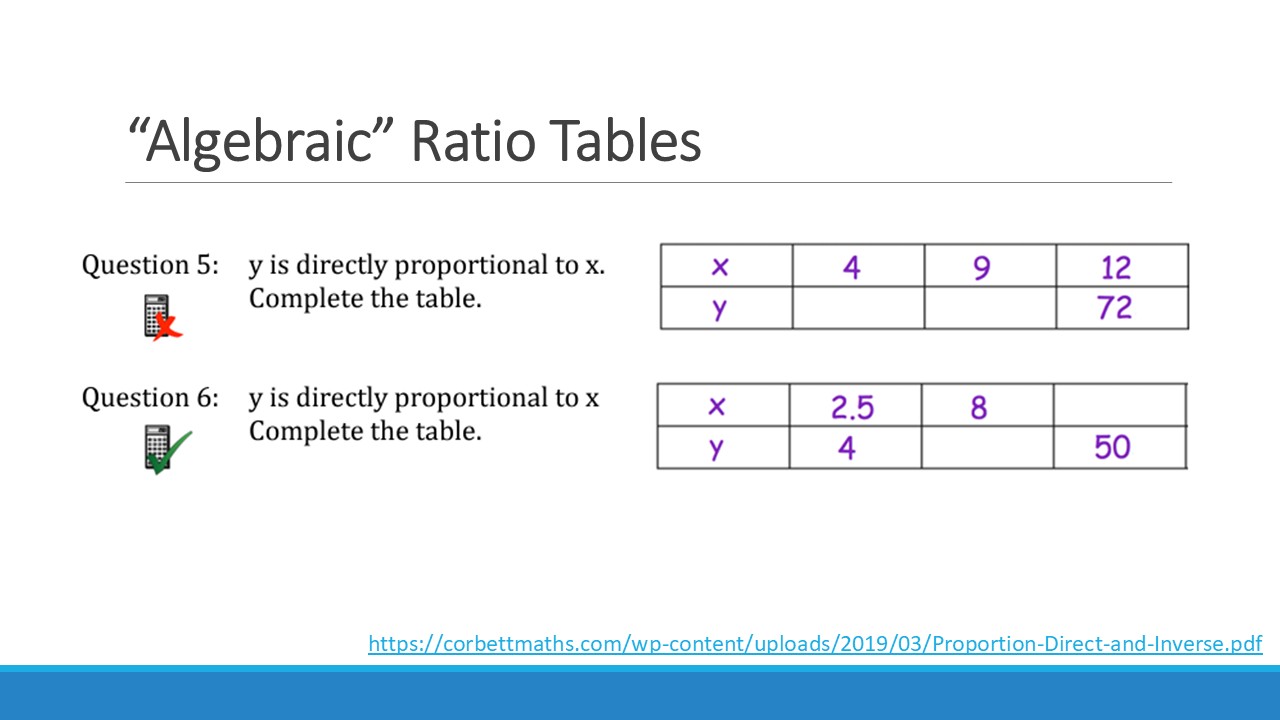
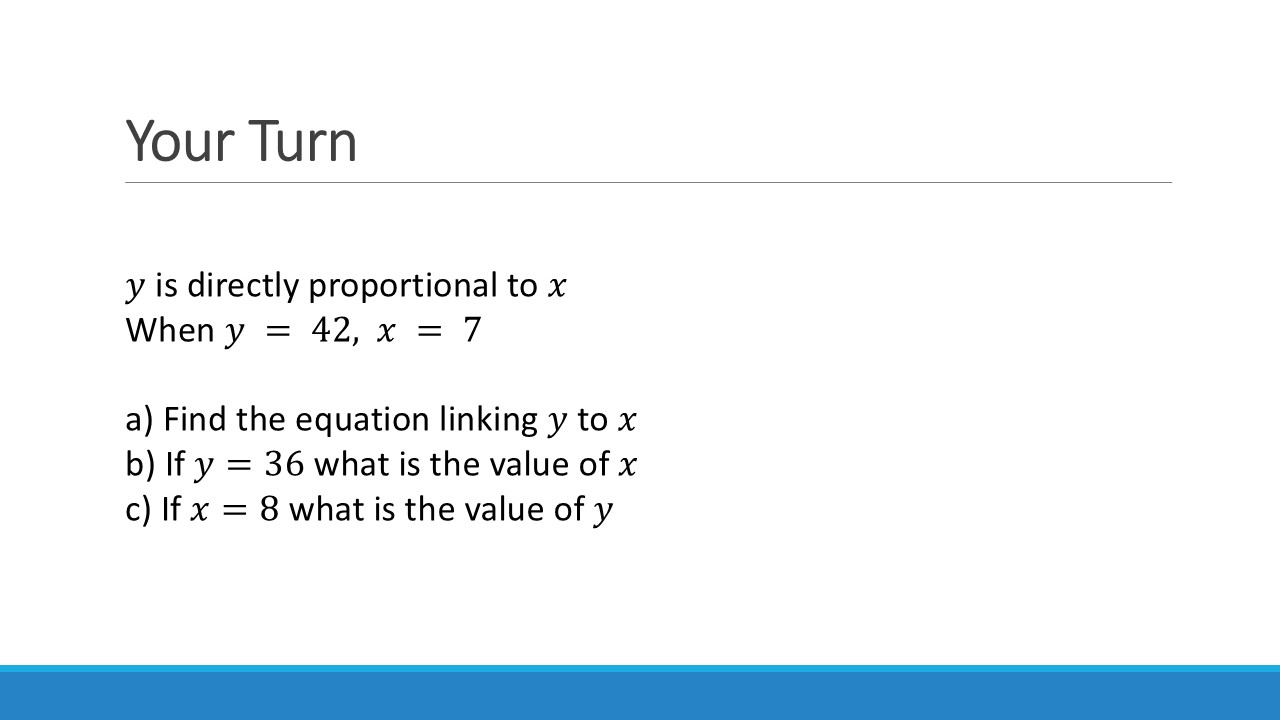
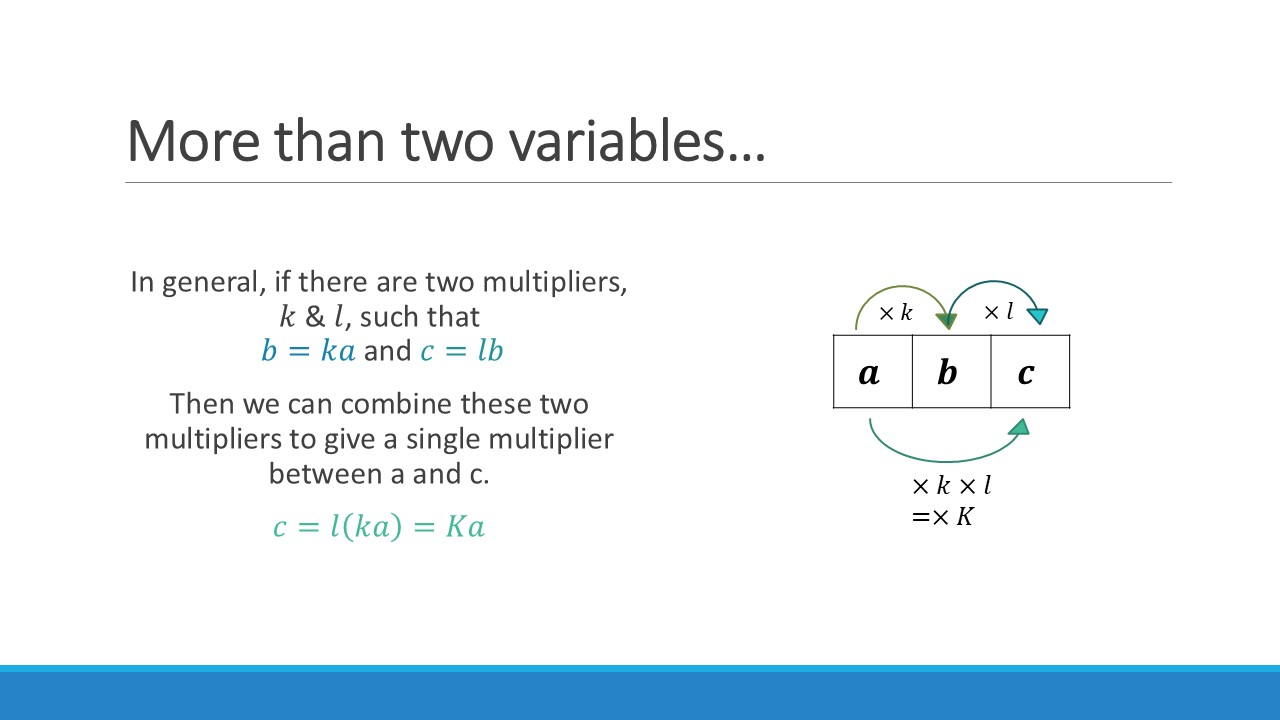
We set up tables with the information from the question, giving our tables headers for each variable, and look for the multipliers within and between them. We can then generalise by placing one variable in its column and completing the relevant multiplication – then we’re gifted with the algebraic relationship. (see the blue and yellow highlights below).
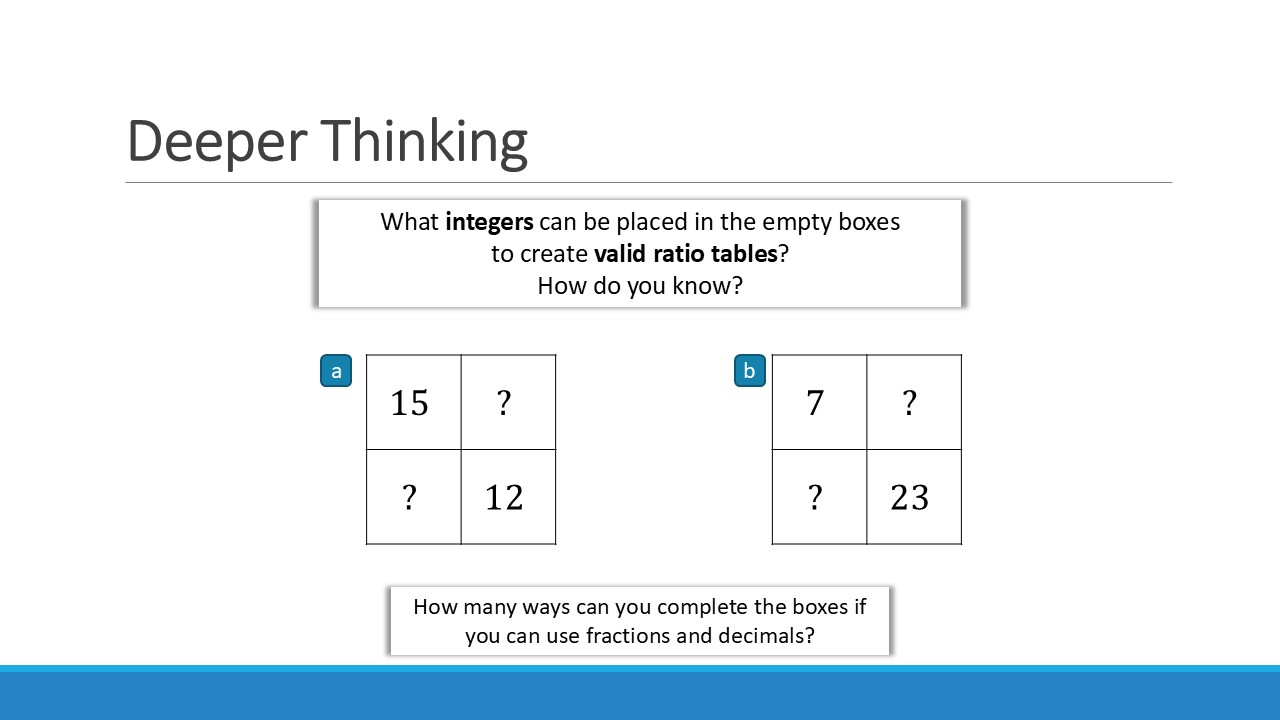
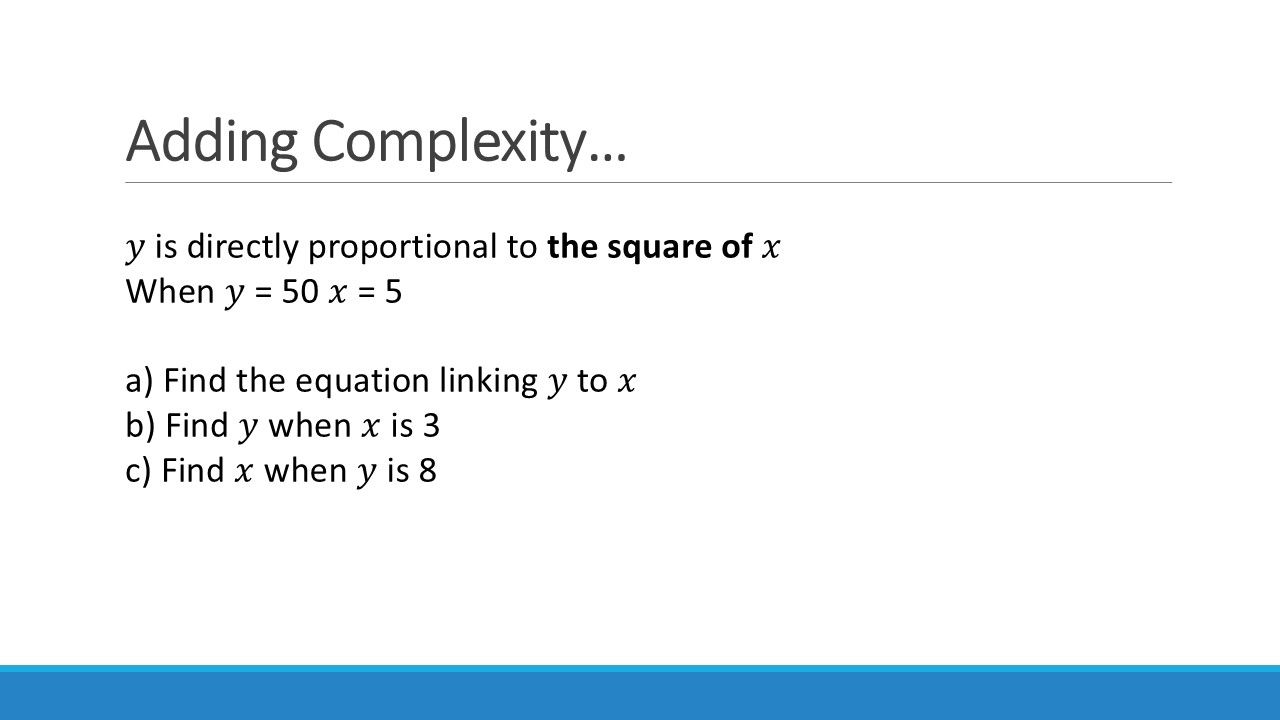
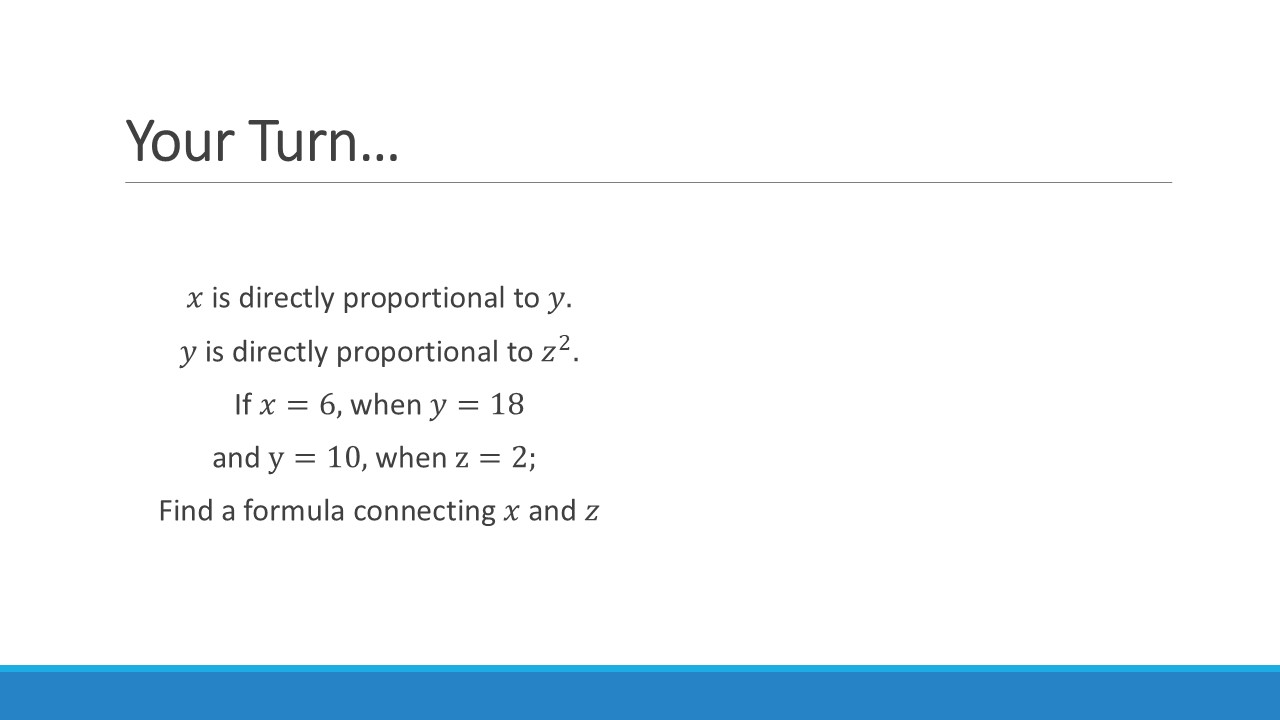
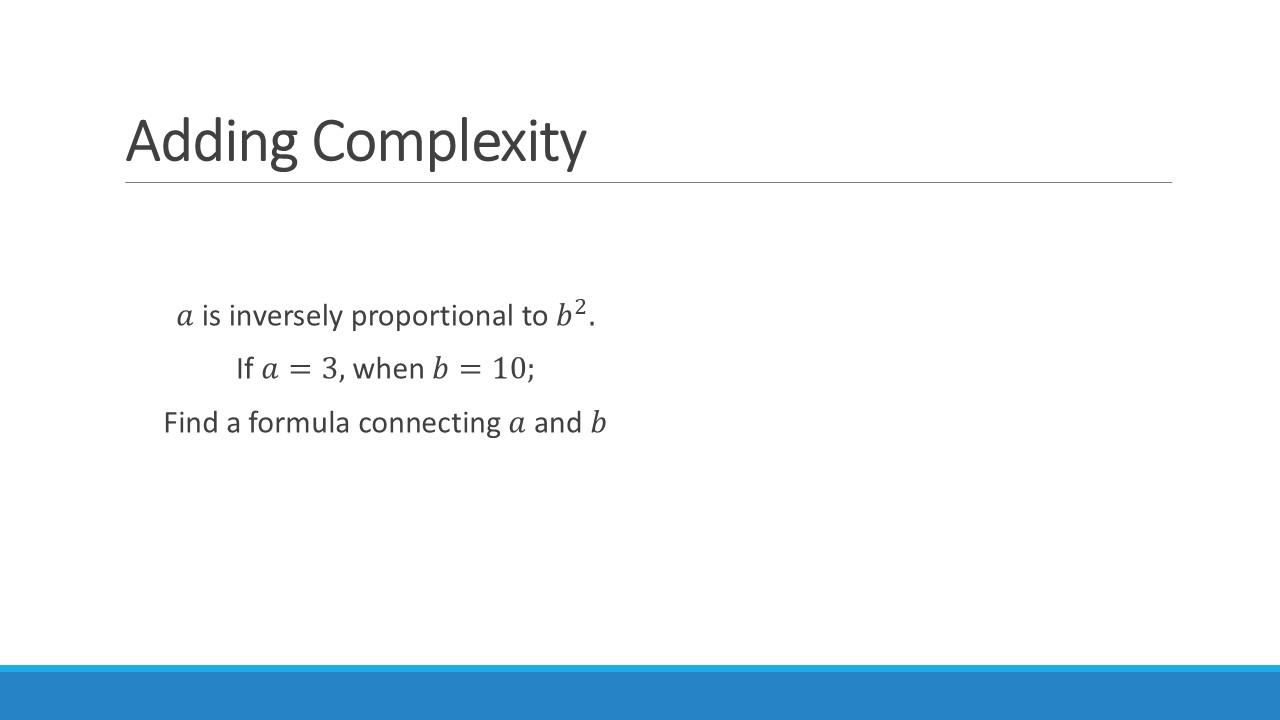
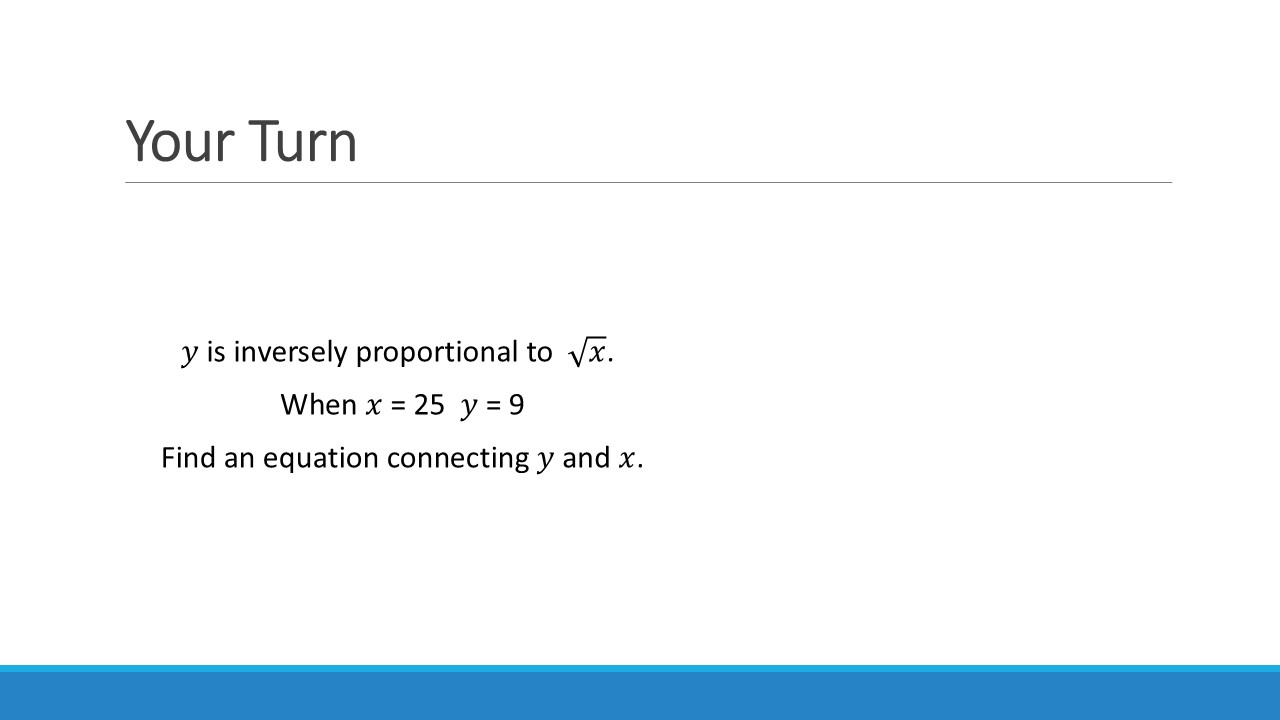
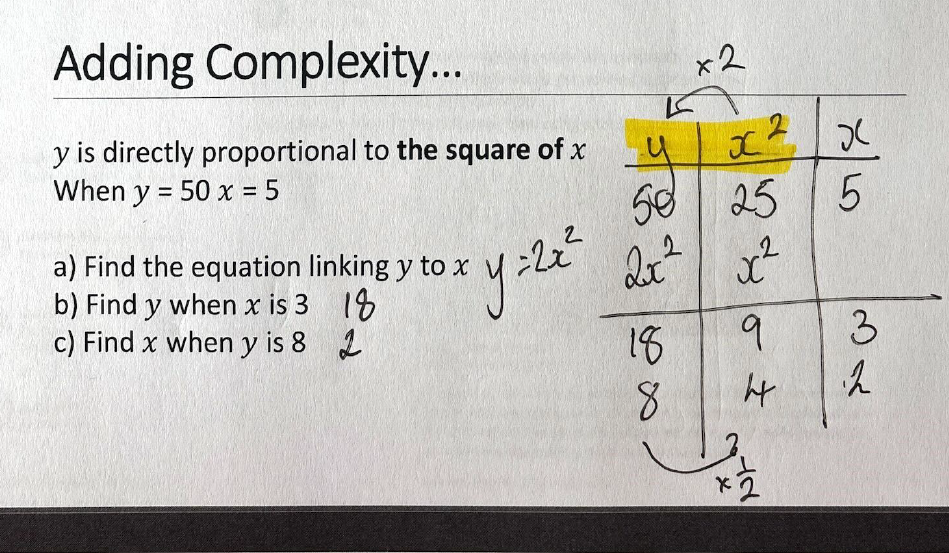
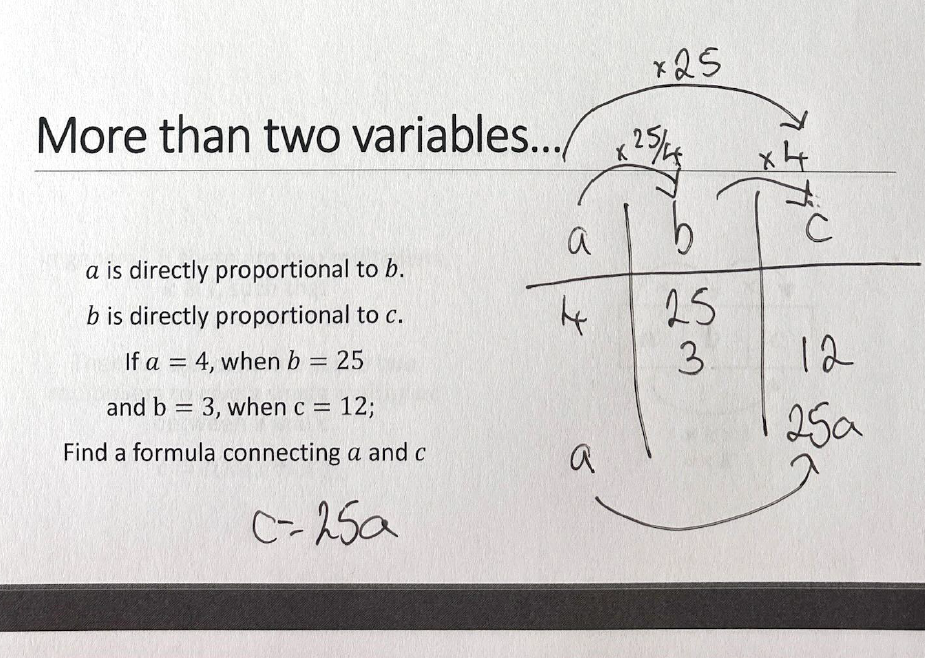
The power of this lies in the ability to add columns for more complex relationships, like a square or a root, or even adding columns to consider multiple variables, with just as much ease.
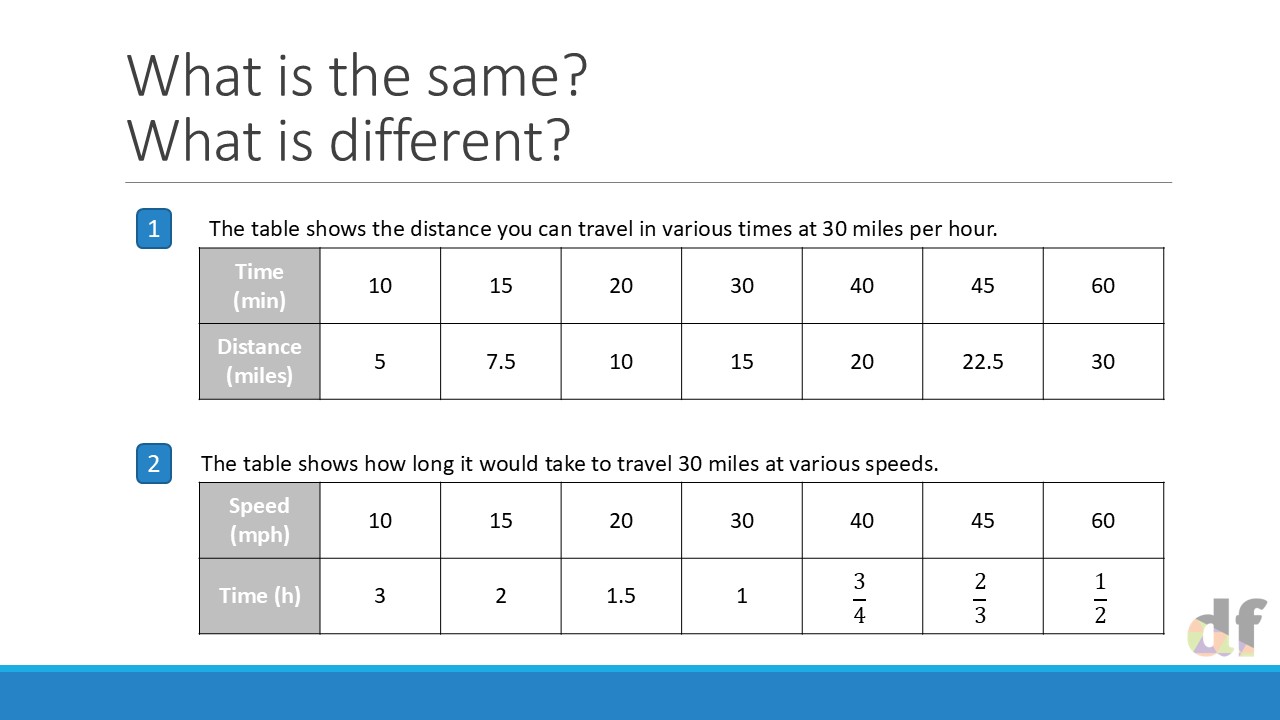
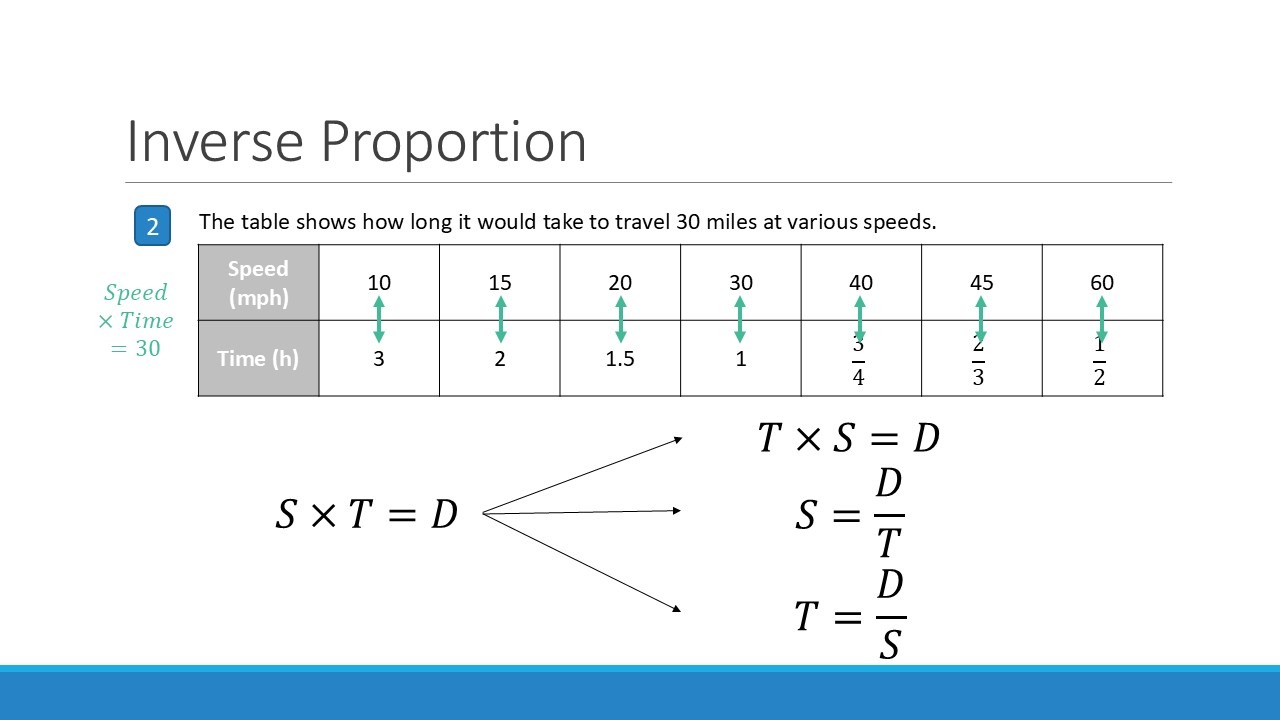
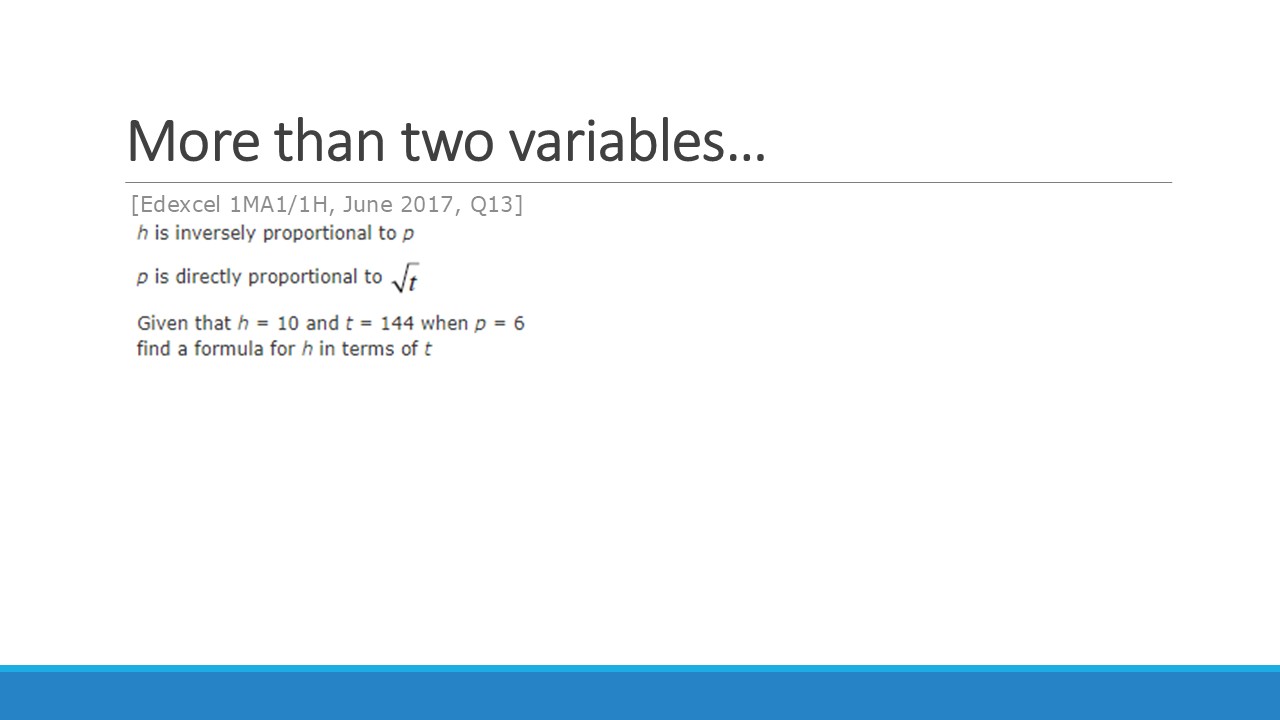
Inverse Proportion
It took me a while longer to work out how this translated to inverse proportion problems. I didn’t want to use a totally different structure for these – the ideas are too linked. But I was worried about how students would know the difference between them. The lightbulb moment for me was noticing that the ‘diagonals’ of the direct proportion boxes work in the same way as an inverse proportion relationship – they have a constant product. And I made sure my students were confident with this through my teaching of direct proportion, so I knew they could handle the maths behind it.
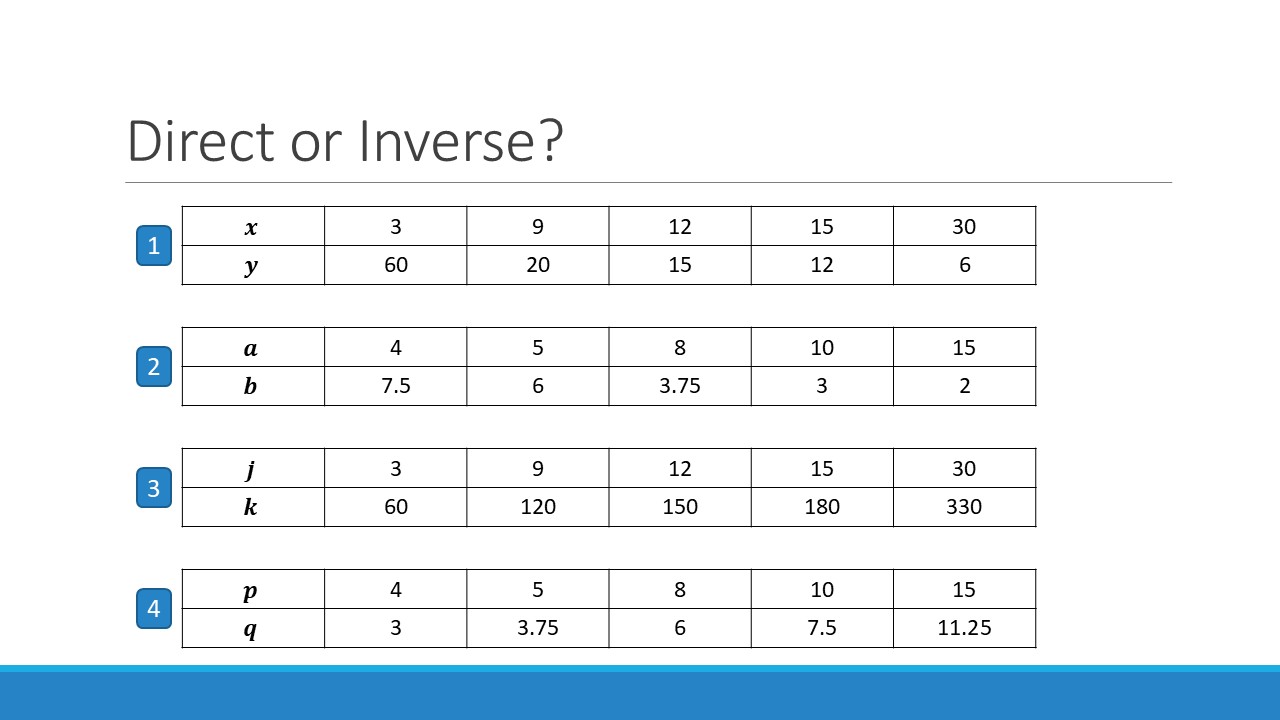
Once I had this settled in my head, it became about showing students how to look for this relationsip between variables, and differentiate it from a direct proportion relationship. So I made it part of my exposition, initially by comparing the different variables in the (now very familiar) speed-distance-time relationship, and then ensuring students had sufficient practice of telling the difference between relationships that are direct, inverse and neither.
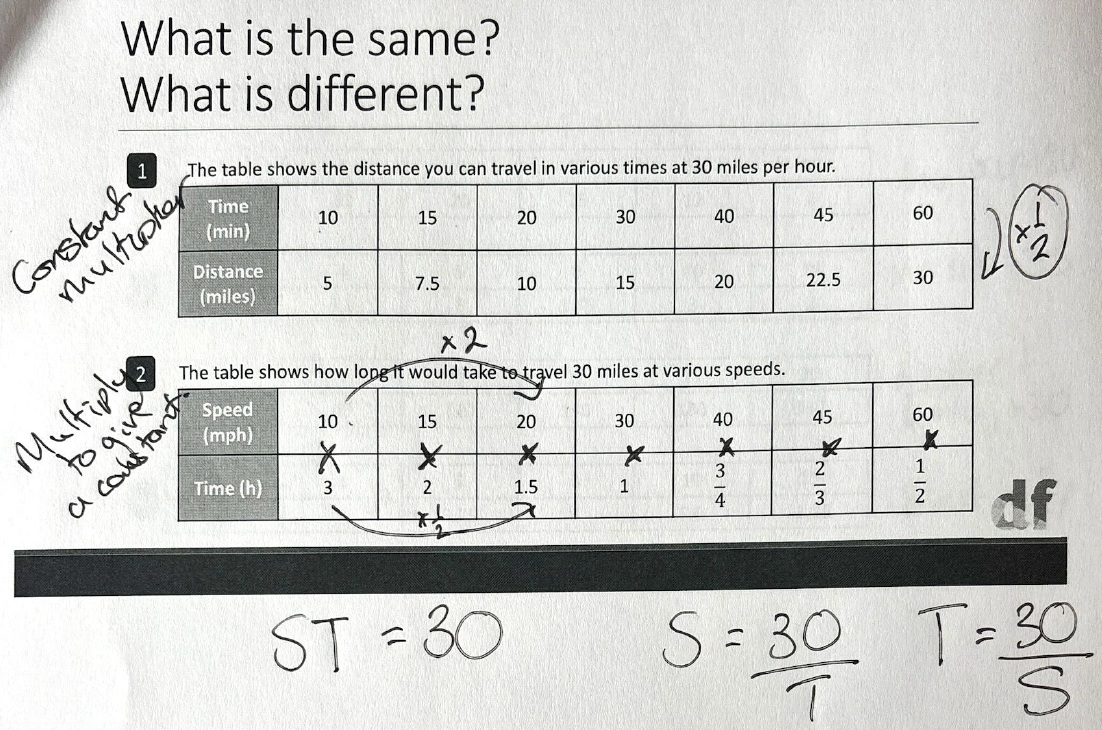

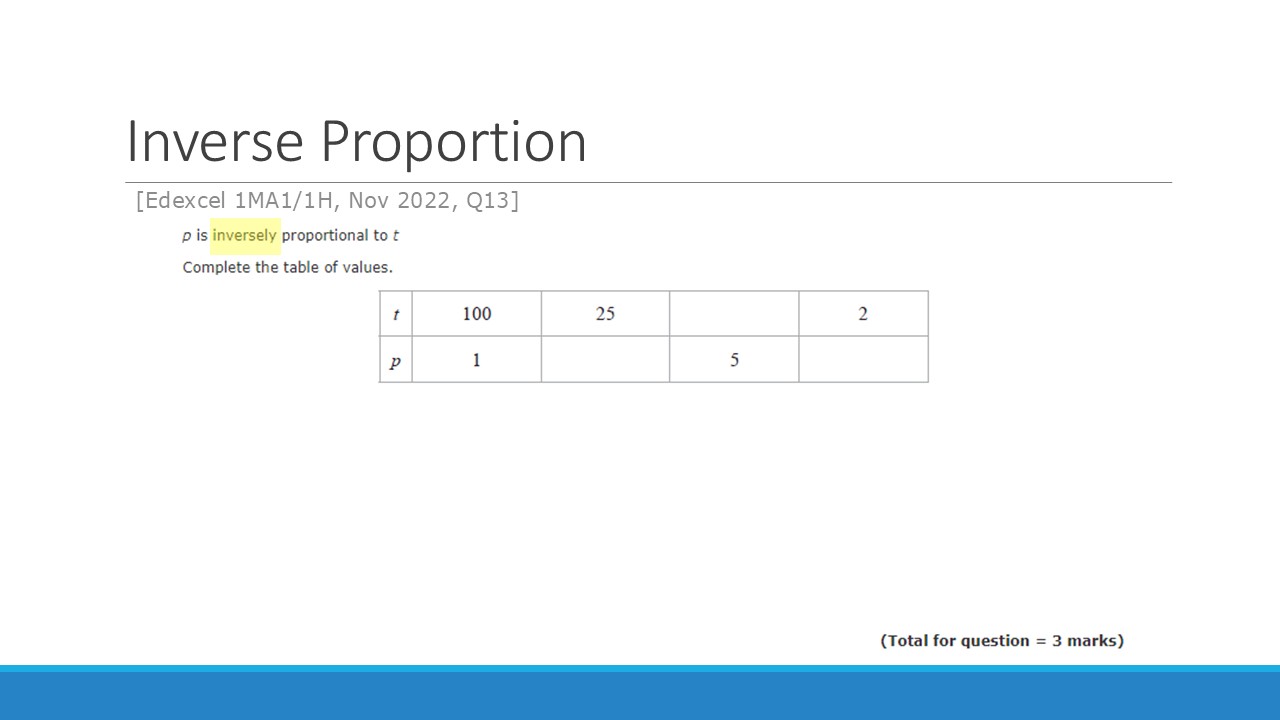
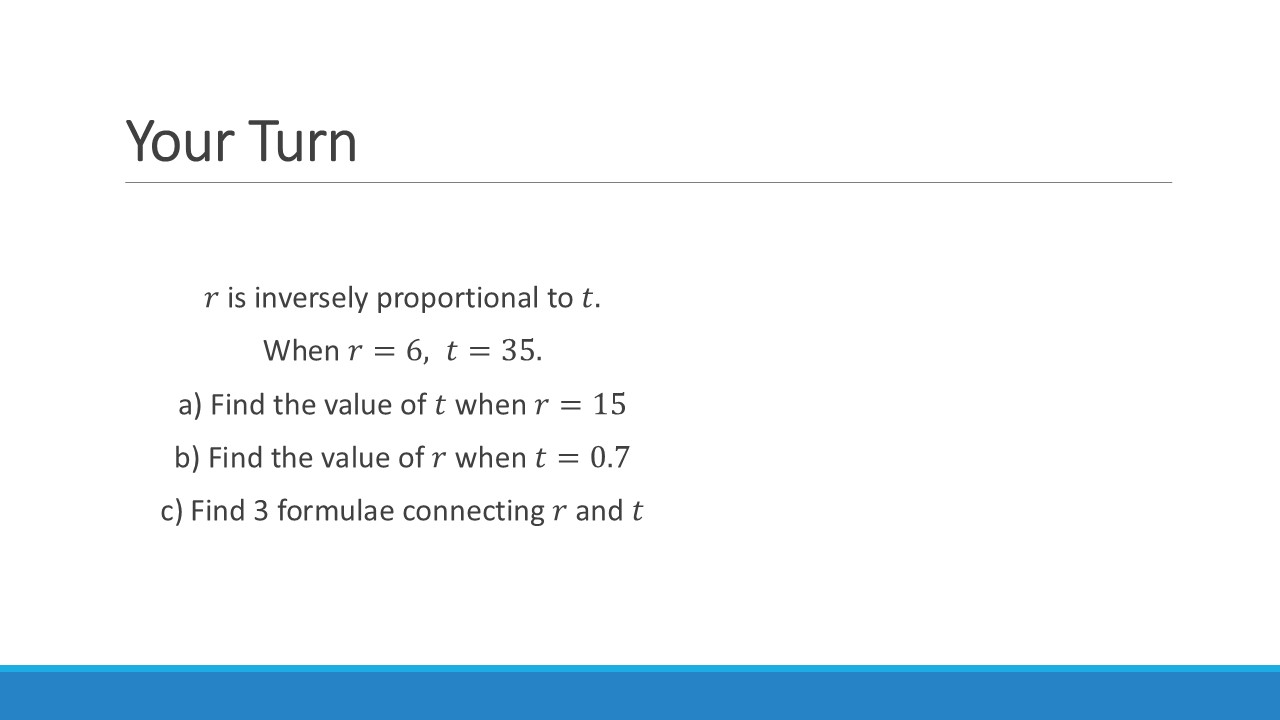
Then inverse proportion problems become somehow even easier than a direct relationship: variable 1 x variable 2 = constant... Every. Single. Time.
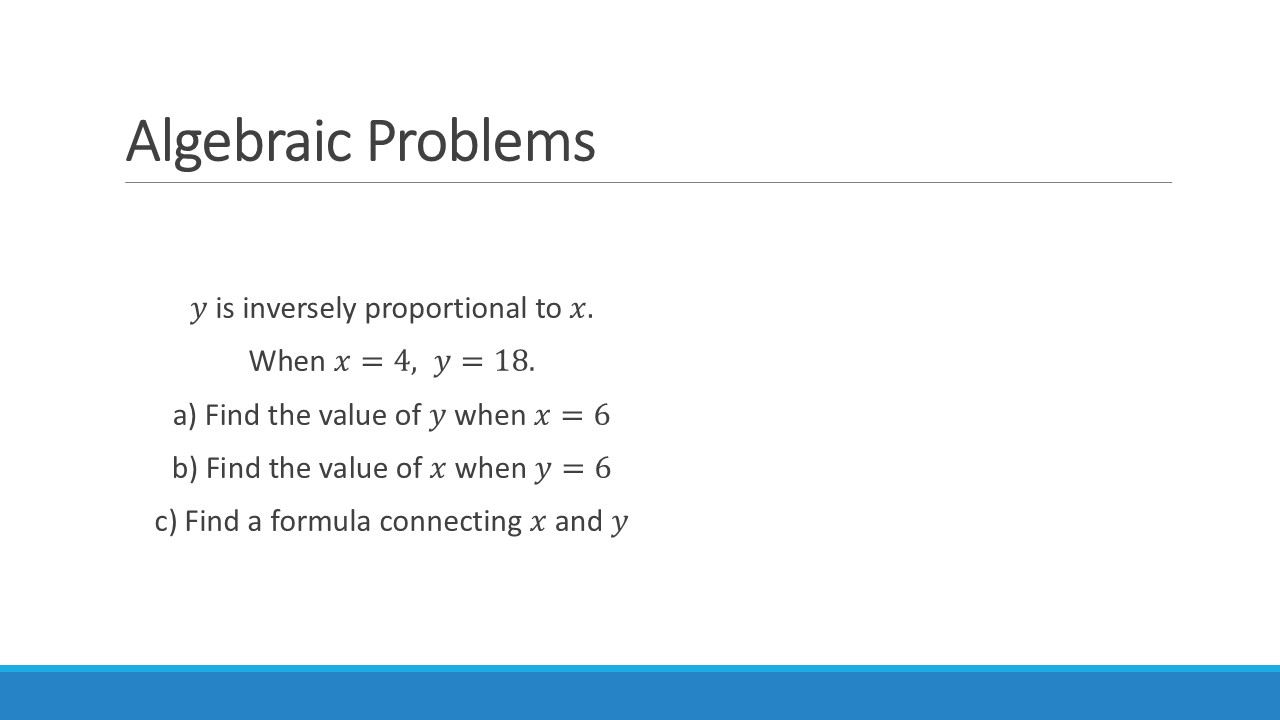
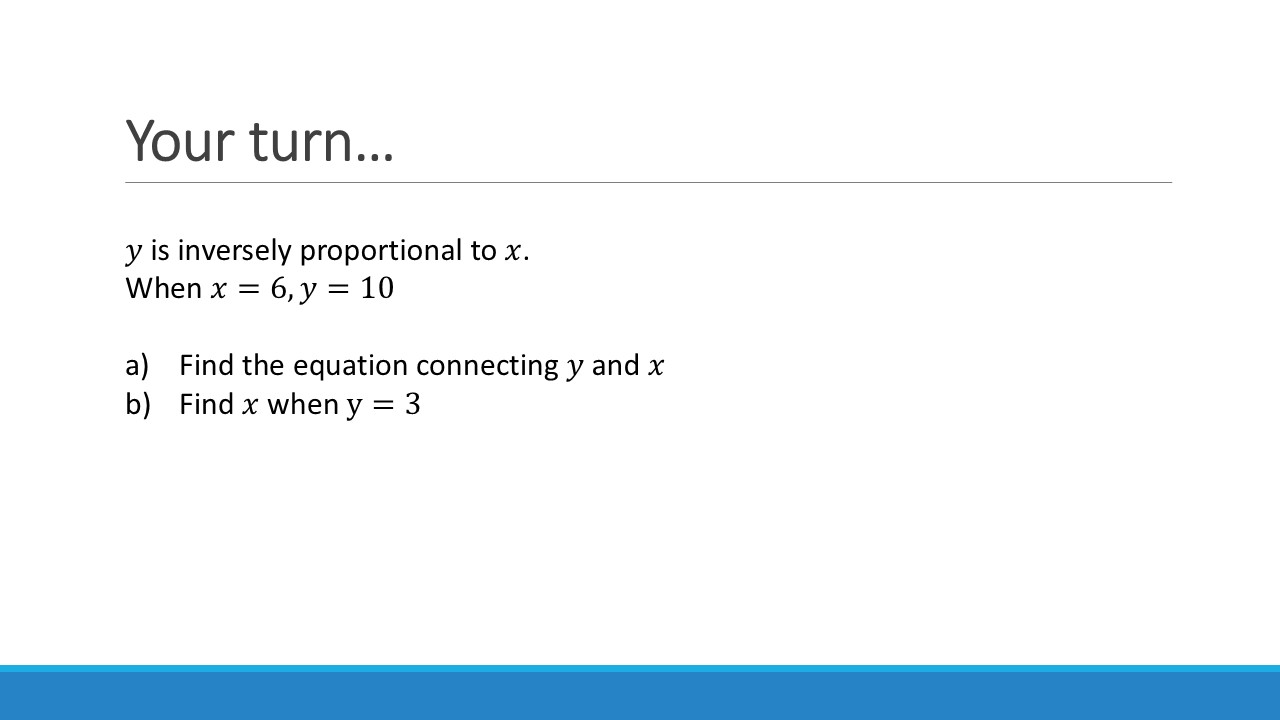
There is then the hurdle of writing this relationship as stated in the question. This is usually written as ‘Give a formula for y in terms of x’ or similar. Here, the key is for students to be really confident in rearranging equations, and then they can manipulate as required.


Again, we can increase the difficulty of this by introducing more complex relationships & multiple variables. You can even start mixing up direct and inverse relationships!
A Caveat – Algebra isn’t the Enemy!
Remember that the aim here is that students have an understanding of these two relationships and to easily show it. For me, this method is an important part of my initial instruction for all students to ensure they have deep conceptual understanding of proportion and the ability to generalise these relationships between variables. But that is not to say that generalising to use the formulae should be avoided entirely (just like with compound measures). Ratio tables should be a helpful tool in students’ arsenal; a way to build up understanding, not the ‘method’ that should be used at the exclusion of others or stopping students to develop more efficient methods.
For many of our students, once these ideas are internalised, they can be used fluently with much less structure or moving to purely algebraic representations – particularly for those students at higher tier. However, beginning to build the concept in this way with novices means that students have clear and consistent representations that link mathematical ideas as abstraction increases and scaffolds to fall back on if needed.
An important example of this is questions that combine direct and inverse relationships, as mentioned above. For these, I will say that insisting on working in the table adds unnecessary complexity. It can get very messy to deal with these all at the same time in a table. I would want students tackling these kinds of problems to be able to work with the algebraic form from the beginning, and not be reliant on a ratio table at this stage. I’d argue that the table is really useful for developing fluency with the numerical forms of these relationships, and moving confidently between the types of proportion is essential for the “machine-day” style questions. However, those that require writing an algebraic relationship between variables of different types of proportion should probably not be tackled in a table – and if students are not at a point of being able to use the algebraic form, work needs to be done to help them to do so before tackling these types of question.
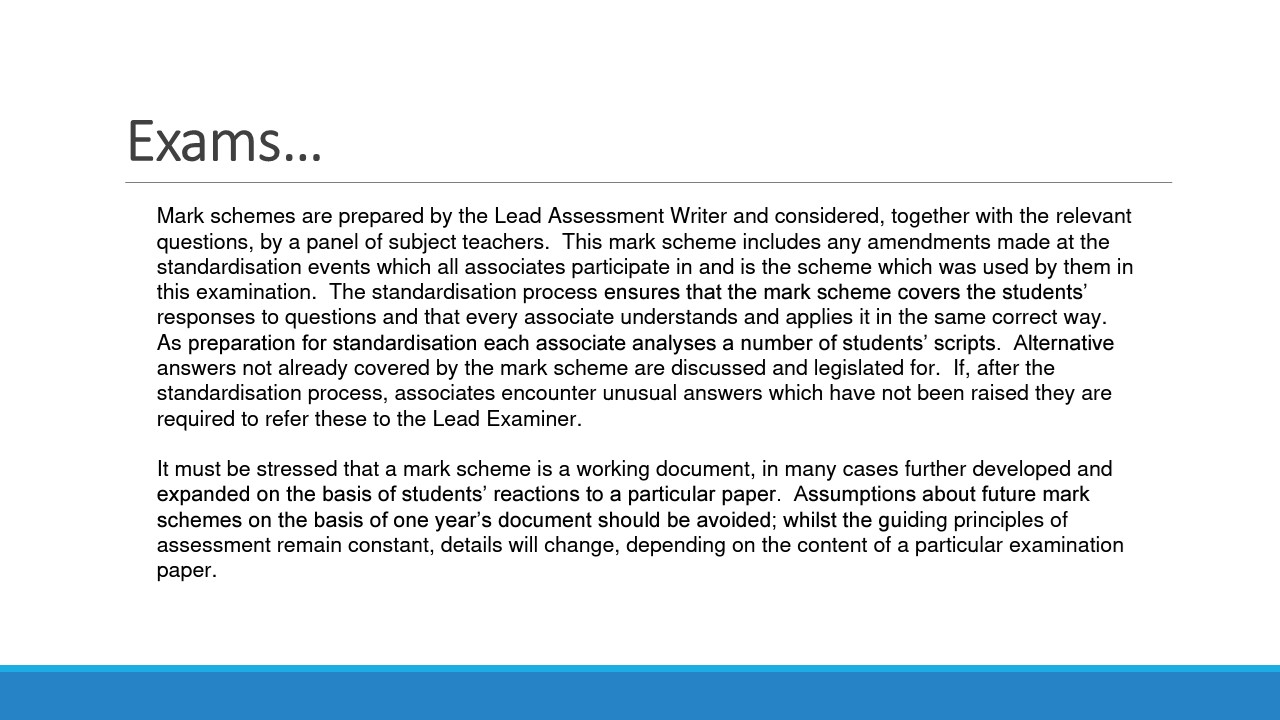
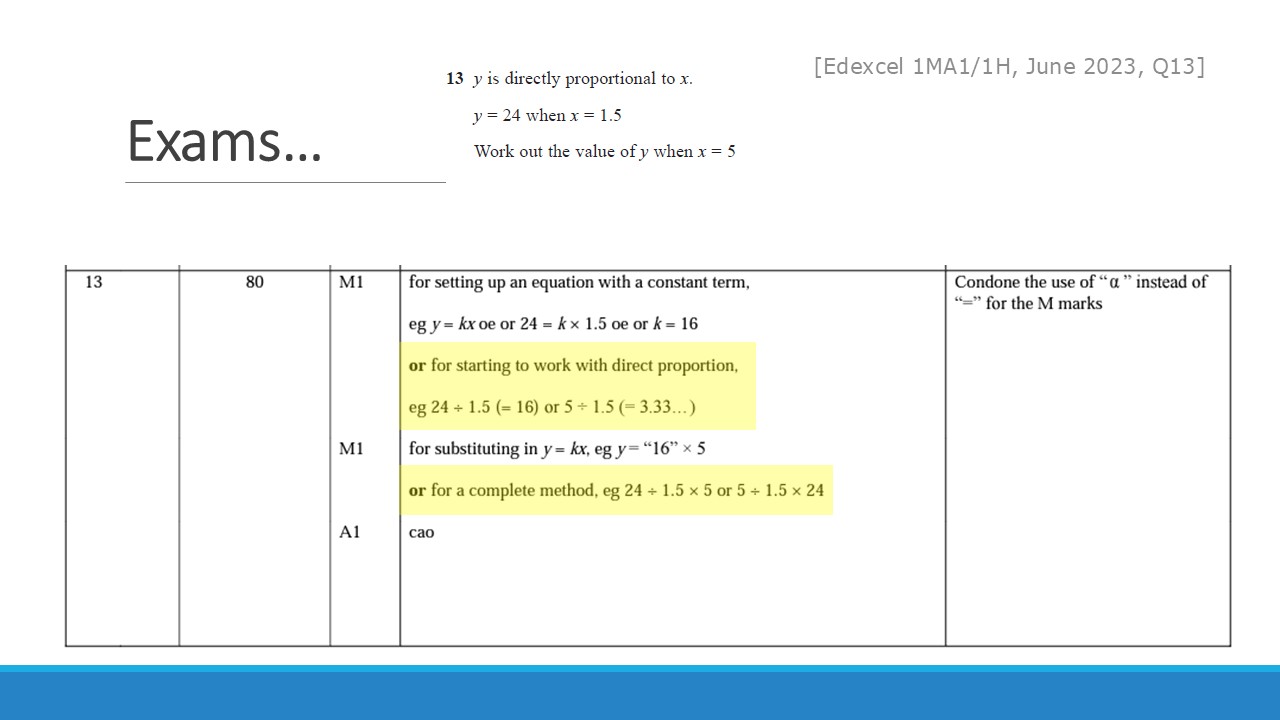
Ratio Tables & Exams
The question I am asked most about this method is if examiners allow for it in their marking. And it’s a very valid question – if we spend our time teaching in this way, are the students going to be rewarded for their understanding with marks in the exams. Its a sad reality that we have to consider this, but a reality nonetheless.
Thankfully, the answer is yes. Historically, M1 marks (in Edexcel GCSE, at least) were given for writing something like y=kx as the first line of working, however ‘any valid method’ should be marked correctly by an examiner or referred up the chain if they are unsure. In the case of proportionality, this translates as understanding the multiplicative nature of the relationship between the variables. Which means when using the ratio table method, the multiplier between the variables just needs to be noted explicitly. This has been reflected in mark schemes over the last few years.
Slides & Annotations
I’m going to stop blabbering now, and instead leave you to work on this yourself – there is no substitute for trying it, in my opinion. Below are images of each slide, and then the slides (blank) and the version I scribbled on through the session, so you can see my modelling and all the answers for yourself. I would suggest that you have a look at the models and try the questions as if you had been in the session, then going off to practice some on your own before taking it into the classroom.
As always, I would love to chat to you if you try this out, be that with any burning questions or to tell me how it went. You can usually find me on BlueSky (rather than at the other place…) or pop me an email if you want to do so!